
PSX Trading Activity Overview:
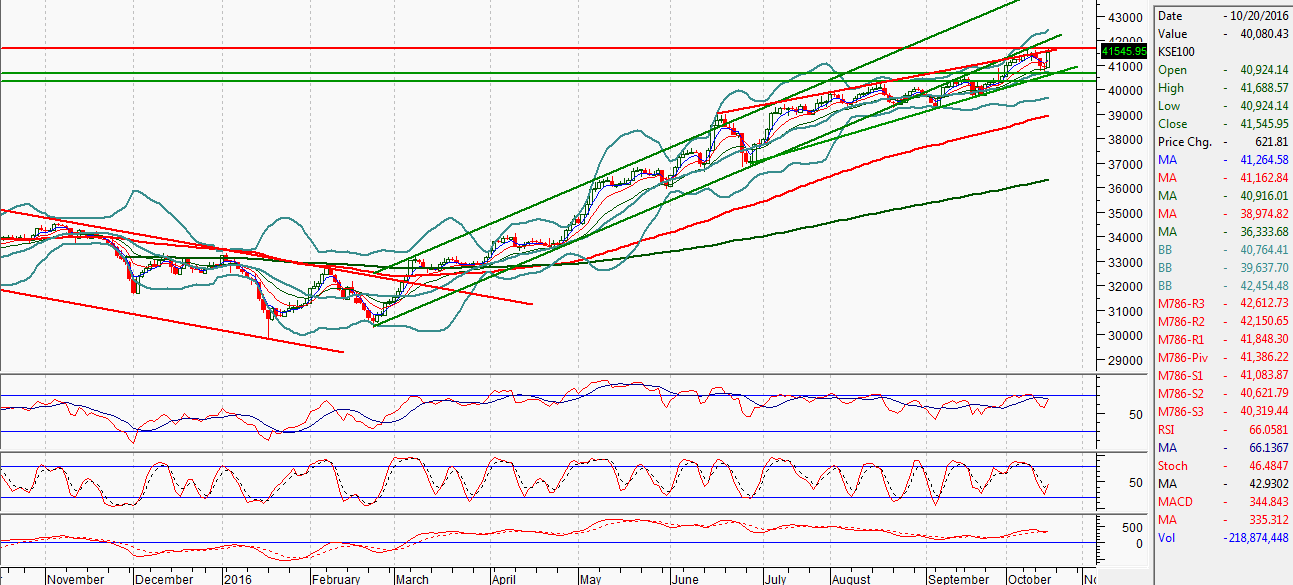
The Bench Mark KSE100 Index Opened at 40924.14 and started moving in positive direction from same level keeping it as day low and posted day high of 41688.57 points during last trading session while session suspended at 41545.95 points with net change of 621.88 points and trading volume of 218.87 million shares. Daily trading volume of KSE100 listed companies increased by 52.18 million shares or 31.30% on DOD bases. While market capitalization of KSE100, ALLSHR and KSE30 Indices increased by 30.49, 109.59 and 23.34 billion Rs on DOD bases.
Foreign Investors remain in net selling of 6.68 million shares and net value of Foreign Inflow dropped by 3.66 million US Dollars. Categorically Foreign Individual, Corporate and Overseas Pakistani Investors remain in net selling of 30800 shares, 4.86 million shares and 1.79 million shares respectively. While on the other hand Local Individuals and Banks remain in net selling of 31.05 and 12.49 million shares, but Local Companies, Mutual Funds and Brokers remain in net buying of 11.49, 32.56 and 1.7 million shares respectively.
Foreign Investors remain in net selling of 6.68 million shares and net value of Foreign Inflow dropped by 3.66 million US Dollars. Categorically Foreign Individual, Corporate and Overseas Pakistani Investors remain in net selling of 30800 shares, 4.86 million shares and 1.79 million shares respectively. While on the other hand Local Individuals and Banks remain in net selling of 31.05 and 12.49 million shares, but Local Companies, Mutual Funds and Brokers remain in net buying of 11.49, 32.56 and 1.7 million shares respectively.
| Month Till Date Foreign Investors Portfolio | |||||
|---|---|---|---|---|---|
| Rep_Type | Buy Volume | Sell Volume | Net Volume | Net Value | USD Value |
| FOREIGN INDIVIDUAL | 1124440 | -6444924 | -5320484 | -95723872 | -911651 |
| FOREIGN CORPORATE | 86454218 | -103470357 | -17016139 | -1905896647 | -18151394 |
| OVERSEAS PAKISTANI | 197831699 | -192294540 | 5537159 | 162240504 | 1545146 |
| Grand Total | 285410357 | -302209821 | -16799464 | -1839380012 | -17517903 |
| Month Till Date Local Investors Portfolio | |||||
|---|---|---|---|---|---|
| Rep_Type | Buy Volume | Sell Volume | Net Volume | Net Value | USD Value |
| INDIVIDUALS | 5102311197 | -4921737494 | 180573703 | -427947008 | -6838948 |
| COMPANIES | 261795123 | -321415545 | -59620422 | -197566043 | -1881579 |
| BANKS / DFI | 109332483 | -223441912 | -114109429 | -2583364232 | -24603465 |
| NBFC | 45337980 | -26590268 | 18747712 | 1779699584 | 16949516 |
| MUTUAL FUNDS | 173495750 | -143727398 | 29768352 | 3609066506 | 38030099 |
| OTHER ORGANIZATION | 55392715 | -56204085 | -811370 | 382523448 | 3643080 |
| BROKER PROPRIETARY TRADING | 902771292 | -940520374 | -37749082 | -816984337 | -7780804 |
| Grand Total | 6650436540 | -6633637076 | 16799464 | 1839380012 | 17517905 |
PSX Daily Technical Overview
Technically KSE100 Index have over shot yesterday by moving around 620 points in positive direction. It was expected that market will bounce back from 40660 points but this behavoiur was not expected which is witnessed in result of over excitment of some mutual fund managers and institutional account managers. Crude oil prices have reacted as per expectation and bullish rally in Crude prices halted before resistant region of 52.54 USD/bbl after expiring effects of a significat drop in US Crude oil Stock figures. Even bad jobs data from American side could not pump some fresh air in oil prices and they keep moving in downward direction to settle around 50.63 USD/bbl at end of last trading session. American jobs data was worse then expectations but its effect was vanished by good Philadelphia Fed manufacturing Index which was much better then expectations. For current trading session crude oil prices have a supportive regions around 50.10 and 49.68 USD/bbl from where it can bounce back to support oil sector but if it will not become able to recover from these levels then oil sector would add some pressure in market which can effect current bullish trend. Technically KSE100 Index have resistant region around 41700 points from where it can be pushed back and if it will not become able to close above that level then it can bounce back towards 41124 again.
 To Open picture in original resolution right click image and then click open image in a new tab
PSX Weekly Technical Overview
On Weekly Charts KSE100 Index have generated a bullish engulfing pattern but negative effects of last evening start still have not been disappeared. It also have penetrated its bullish trend channel in negative direction and right now its cagged in a bullish wedge. Downward penetration of that wedge will call for a downfall of around 1000 Points.
 To Open picture in original resolution right click image and then click open image in a new tab
PSX Comparison with Int. Indices:

0 Comments
Please log in to leave a comment.