
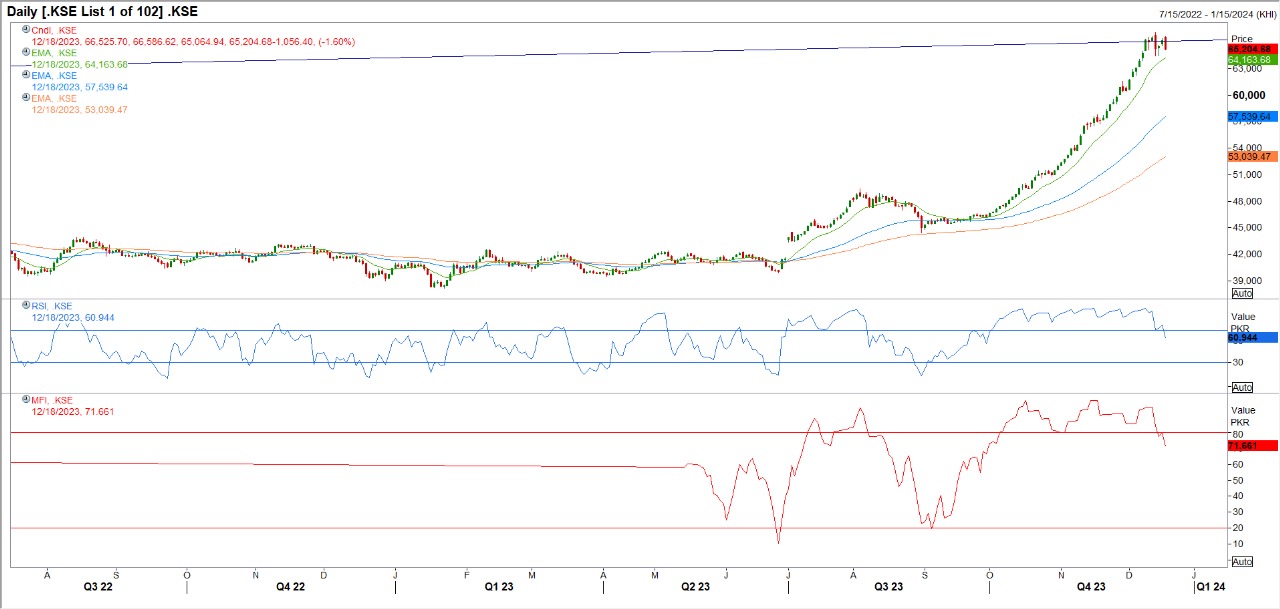
KSE 100
Resistance regions are 65280 and 65860. Support regions are 64660 and 64420. On daily chart price action is supporting momentum indicators which show that bears will be prevailing in market.
KSE100 Index barfing 19 December 2023
- Home
- psx-analysis
- KSE100 Index barfing 19 December 2023
19
Dec 2023
BY ADMIN
POSTED IN psx-analysis
PERMALINK
51 Views
KSE100 Index barfing 19 December 2023
Tags: KSE100 KSE100 Analysis KSE100 Technical Analysis KSE100 Price Forecast
- OGDC Short term analysis 18th March 2024 2024-03-18
- LUCK SHORT TERM ANALYSIS 28TH NOVEMBER 2023 2023-11-28
- USDCHF Intra-day Analysis 18th Jan. 2023 2023-01-18
- PPL short term analysis 26th February 2024 2024-02-26
- WTL Short Term Analysis 22 February 2024 2024-02-22
- PPL short term analysis 14th May 2024 2024-05-14
- OGDC Short term analysis 14th May 2024 2024-05-14
- NML short term analysis 13th May 2024 2024-05-13
- HCAR short term analysis 13th May 2024 2024-05-13
- MLCF short term analysis 13th May 2024 2024-05-13
0 Comments
Please log in to leave a comment.